






 Oct 19,2026
 By admin

In price action trading, traders usually begin by identifying areas where price may react, such as support, resistance, previous highs, previous lows or important breakout levels. However, reaching one of these areas does not automatically mean that price will reverse or continue in the expected direction.
For instance, pair may approach a resistance level that has held several times before. A trader expecting another rejection may consider selling immediately, but price can just as easily move through the same level and continue higher.
This is where entry confirmation in trading becomes useful. Rather than entering only because price has reached a particular area, the trader waits for some evidence that the expected reaction is actually developing.
There are several ways of doing this, although some are more common than others among traders who rely mainly on price movement.
1. Candle Close Confirmation
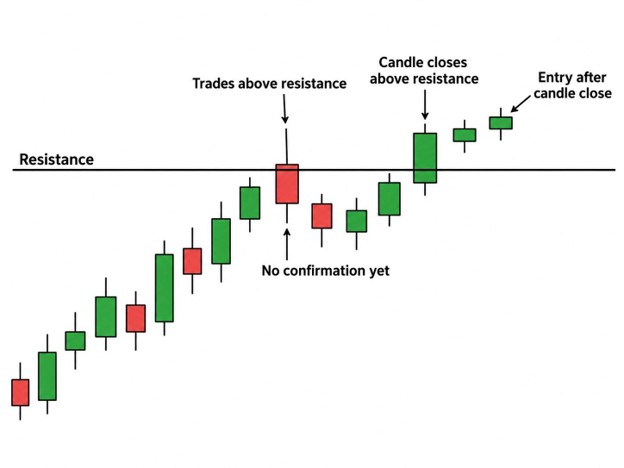
A candle that is still forming can give a very different impression from the same candle after it has closed.
As an example, suppose GBPUSD is trading below resistance at 1.2750. During a 15-minute candle, price moves above the level and reaches 1.2760. At that point, the move may appear to be a breakout.
However, price later falls back and the candle closes below 1.2750.
The final candle now shows that buyers were able to trade above resistance but failed to keep price there.
For this reason, waiting for the candle to close is one of the more common methods of price action confirmation. The trader is not simply watching where price traded during the candle, but where it was able to finish.
A close above resistance may provide stronger evidence that the level has broken, while a candle that briefly trades above resistance and closes below it can indicate rejection.
Similarly, price may move below support during the candle but close back above it. Here, it is noteworthy that the temporary break and the final close are showing two different things.
The first tells the trader that price moved beyond the level. The second shows that the move was not maintained.
That said, the timeframe being used also matters.
A five-minute candle may close above resistance while the one-hour candle is still trading within the previous range. Consequently, traders using forex price action trading often compare the entry timeframe with a higher timeframe before treating one candle close as sufficient evidence.
Waiting for the close also has an obvious limitation. If price moves strongly during the candle, the eventual entry may be considerably worse than the price available earlier.
So, this form of confirmation provides more information, but it can also mean entering later.
2. Rejection Candles Around Important Levels
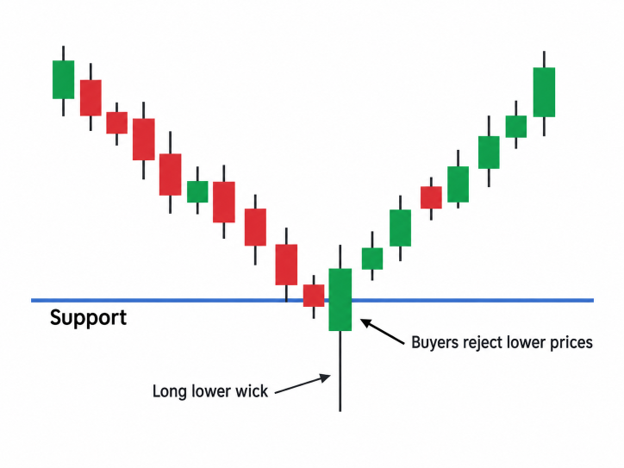
Rejection is another commonly used form of price action confirmation entry.
This usually occurs when price moves into or beyond an important area and then turns back, leaving a visible wick on the candle.
Suppose EURUSD is trading around support at 1.1800. Price falls to 1.1785 during the session but later moves back above 1.1800 and closes at 1.1810.
The lower wick shows that sellers managed to push price below support, although they were unable to keep it there.
A trader considering a long position may view this as evidence that buyers have responded around the level.
The same can happen at resistance. Price may trade above the area, fail to remain there and leave a long upper wick before closing lower.
Rejection candles are often included among common price action trading patterns, although their location usually matters more than the shape alone.
For example, a long wick appearing in the middle of a sideways range may carry relatively little significance. The same candle forming at a previous daily high can be more meaningful because price is reacting around an area that traders were already watching.
Moreover, the size of the candle should be considered in relation to recent market movement.
A very large wick during a major economic announcement can simply reflect a sudden increase in volatility. It does not necessarily mean that a reliable reversal has formed.
This is why traders often combine rejection with price action confluence.
A resistance area may also coincide with a previous high, a trendline or a broader range boundary. In this case, the rejection is not being considered in isolation.
3. Breakout and Retest Confirmation
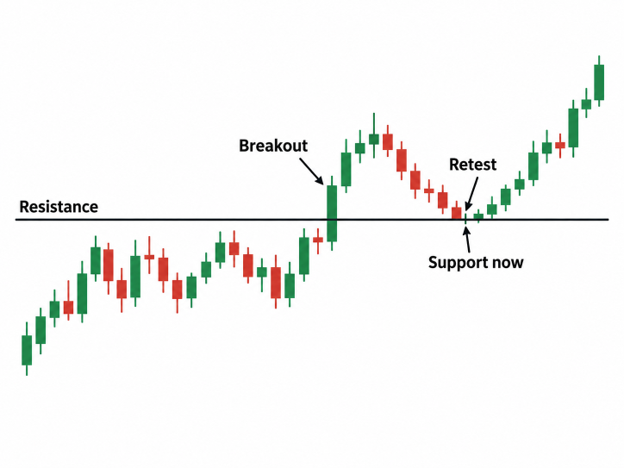
Some traders prefer not to enter during the initial breakout itself.
Instead, they wait to see what happens when price returns to the broken level.
Suppose GBPUSD has remained below resistance at 1.3000 for several sessions. Price eventually closes above the level and moves to 1.3030.
Later, it falls back towards 1.3000.
If buyers begin appearing around the former resistance and price starts moving higher again, the same level is now behaving as support.
This is commonly referred to as a breakout and retest.
For traders using a price action trading strategy, the retest can provide useful information because the market has already interacted with the level once during the break and again after returning to it.
The same principle applies when support breaks.
A level that previously supported price may later act as resistance if price moves below it and then returns from underneath.
However, retests do not always occur exactly at the original price.
For instance, a breakout above 1.3000 may pull back only to 1.3010 before continuing higher. In another case, price may move slightly below 1.3000 and still recover.
Hence, expecting a perfect touch can sometimes be too restrictive.
There is also the possibility that the retest fails completely.
Price may break above resistance, return to the same area and then continue falling back into the old range. In this situation, the retest has not confirmed the breakout.
In fact, it may indicate that the initial move was false.
Over the course of a trading session, this distinction can become important because both successful and failed breakouts can begin with a convincing move beyond the level.
The behaviour during the return often gives additional information.
4. Market Structure Confirmation
Not every price action trading entry depends on an individual candlestick.
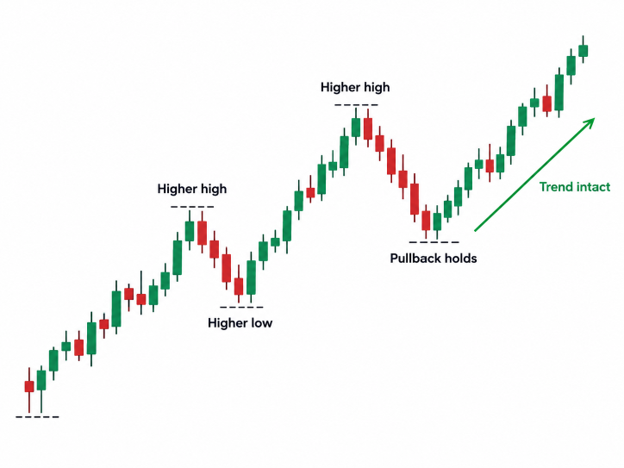
Some traders look at the sequence of highs and lows before deciding whether a setup is worth taking.
In an uptrend, price will often produce higher highs and higher lows. During a downtrend, lower highs and lower lows are more common.
Suppose a market has been trending higher and then begins pulling back towards support.
A trader interested in buying may wait to see whether the pullback remains above the previous swing low. If price holds and begins moving higher again, the broader bullish structure has remained intact.
However, if price breaks below the previous swing low, the situation has changed.
This can matter when a single candle appears to contradict the larger movement.
For instance, a bearish rejection candle may form during a strong uptrend. At first glance, the candle can appear suitable for a short entry.
Yet, the market may still be producing higher lows and may not have broken any meaningful support.
A trader using market structure as entry confirmation trading may therefore avoid the trade until there is more evidence that the earlier trend is weakening.
Similarly, one bullish candle during a downtrend does not necessarily mean that the downtrend has ended.
Here, understanding price action trading requires more than recognizing individual patterns.
The same candle can mean something quite different depending on the structure around it.
A bullish engulfing candle after a pullback into established support is not the same setup as a bullish engulfing candle appearing directly beneath major resistance.
The candle itself may look identical. Its location does not.
5. Volume and Momentum Confirmation
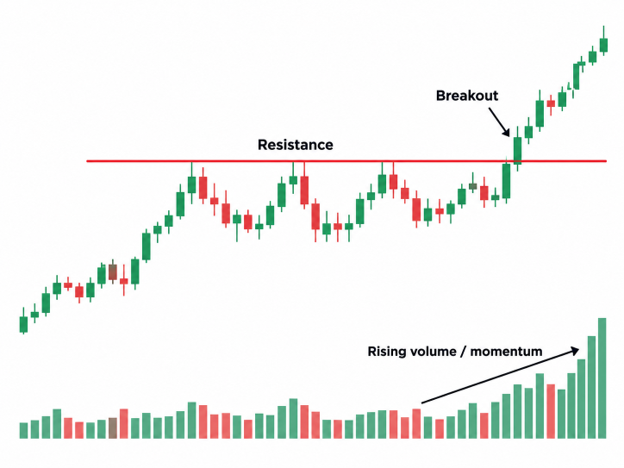
Some traders who mainly rely on price also use volume or momentum as supporting information.
Volume is often considered during breakouts.
For instance, suppose a stock or futures market has remained below resistance for several sessions. Price eventually moves above the level while trading activity increases noticeably.
The rise in activity may support the view that more traders are participating in the breakout.
On the other hand, a breakout taking place on relatively weak volume may be treated with greater caution.
There is an important difference when this idea is applied to spot forex.
The foreign exchange market is decentralized, which means there is no single exchange recording all global trading volume. The volume displayed on many retail platforms is therefore usually tick volume or activity recorded by the broker.
It can still be used as supporting information, although it does not represent every transaction taking place in the market.
Momentum can be considered in a similar way.
Suppose price breaks resistance and continues making larger bullish candles. Momentum is increasing along with the move.
In another example, price makes a new high while momentum becomes weaker. A trader may interpret this as a reason to avoid entering late into the move.
That said, adding too many price action trading indicators can make the process unnecessarily complicated. If every setup requires agreement from several indicators, several candle patterns and several different timeframes, the trader may end up waiting for conditions that rarely occur together.
A price action trading indicator is therefore generally more useful when it supports an existing observation rather than replacing the actual price behaviour.
How Traders Combine Confirmation Techniques
Confirmation techniques do not have to be used separately.
A trader may wait for price to return to support and then look for a rejection candle before entering. Another may wait for a breakout, a retest and a candle close above the level.
For example, consider a resistance level at 1.2500.
Price breaks above it and later returns to 1.2500. During the retest, a bullish rejection candle forms and closes above the level. In this case, the trader has several pieces of information supporting the same idea.
The original resistance has broken, the retest has held and the candle itself shows buyers responding around the level.
This does not mean the trade cannot fail. It simply means the entry is based on more than one observation.
However, traders should also be careful about collecting confirmation for too long.
The more conditions required before an entry, the more likely it becomes that price has already moved away from the preferred area by the time everything agrees.
Consequently, many price action trading strategies use a limited number of confirmation rules that can be applied consistently.
Bottom Line
Entry confirmation can help traders determine whether price is behaving as expected around a level before they commit to a trade.
Candle closes, rejection, retests, market structure and supporting volume or momentum are among the common methods used in price action trading.
However, no confirmation technique can remove uncertainty from the market.
A strong-looking rejection can fail, a retest can break and a well-established structure can change quickly. The purpose of confirmation is therefore not to guarantee the trade, but to give the trader a defined reason for entering rather than acting on the level alone.