






 Nov 03,2026
 By Purvi Patel
Gold has moved through markedly different conditions in 2026.
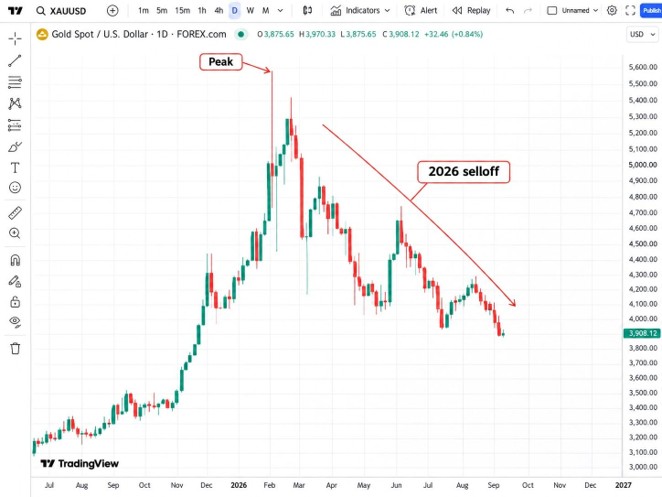
The metal started the year with another extraordinary rally and crossed $5,500 per ounce in January. Later on, the direction changed rather sharply. Gold fell below $4,000 by June, climbed again during August and then entered another difficult period as US Treasury yields and the dollar moved higher.
By November 3, spot gold was trading close to $3,914, almost 30% below its January record of around $5,595. Just a day earlier, it had recovered more than 2% from a one year low.
With that said, such a recovery naturally brings another question. Will gold price recover further, or was the recent rise merely a pause in the broader selloff?
The answer is not particularly straightforward.
Gold has several factors working in its favour even at present. Central banks continue buying the metal, gold ETFs have received considerable inflows and geopolitical risks have certainly not disappeared. On the other side, high bond yields and a stronger dollar have made the present environment comparatively difficult for bullion.
Consequently, the gold price forecast 2026 now depends greatly on how these factors develop over the remaining months.
Before getting into the three possible scenarios, it is worth understanding how gold arrived here in the first place.
Why Did Gold Sell Off in 2026?
Gold’s fall looks particularly large when compared with the beginning of the year.
In January, the metal crossed $5,500 per ounce during one of its strongest starts to a year. By late June, however, it had already fallen below $4,000. The World Gold Council noted that realized volatility moved above 50% during this period, an unusually high level for the gold market.
August subsequently brought another change.
Gold gained around 13% during the month and finished near $4,563. ETF buying and a weaker dollar contributed to the advance. Yet the improvement proved short lived. September ended with gold at $4,176, down 8.5% during the month.
So, why did gold price drop again?
Several developments appeared together.
- The US 10 year Treasury yield climbed as high as 5.3% during September.
- The US dollar strengthened by around 2% over the same month.
- Futures positioning weakened considerably.
- Expectations surrounding US interest rates became less favourable for gold.
- Higher oil prices later revived inflation concerns and increased the possibility of another Federal Reserve rate increase.
Interestingly, the fall happened even while gold ETFs continued attracting money.
The World Gold Council recorded around 67 tonnes of global ETF inflows during September despite the substantial fall in price. It described the combination as highly unusual compared with historical data.
This distinction is important.
Part of the market was selling gold aggressively through futures, while another group of investors continued adding exposure through ETFs. Therefore, the gold selloff did not represent a complete disappearance of demand.
That brings us to the first possible scenario.
Scenario 1: Gold Recovers as Yields Begin to Fall
For gold, interest rates matter a great deal.
The metal does not provide regular interest income. Consequently, when government bonds begin paying higher yields, investors have another comparatively attractive place to hold their capital.
This has been one of gold’s largest problems during the second half of 2026.
For instance, September’s increase in Treasury yields coincided with one of the year’s sharpest monthly gold declines. A stronger dollar added further pressure.
Now consider the opposite situation.
Suppose inflation begins moderating during the coming months and markets gradually reduce expectations of another Federal Reserve rate increase. Treasury yields could start moving lower, while some of the recent strength in the dollar may also fade.
Such conditions could favour a gold price recovery.
In fact, gold offered a small example on November 2. The metal gained more than 2% after falling to a one year low as lower oil prices eased some inflation concerns and the dollar weakened. The improvement was short, though it showed that buyers can still return rather quickly when the macroeconomic background changes.
The World Gold Council had already discussed a similar possibility in its mid year outlook.
According to its scenario analysis, weaker economic conditions or a shift towards lower interest rate expectations could push gold back into an upward trend. Under the more favourable scenarios considered at the time, the organisation estimated gains of around 5% to 20% from prevailing mid year prices.
For easiness, a stronger gold recovery after dip would become more convincing if several developments begin appearing together:
- US inflation starts cooling
- Treasury yields move consistently lower
- expectations of another Fed rate increase weaken
- the dollar loses some of its recent strength
- gold begins holding above previously lost price areas
One positive trading session would provide considerably less information.
The $4,000 region also deserves attention here. Gold recently fell below this level, and a sustained recovery above it could show that buying interest is becoming stronger.
However, January’s record near $5,595 remains quite distant.
A recovery towards earlier trading levels and a full return to the record high are two different matters.
Scenario 2: Gold Recovers Partly and Then Moves Sideways
There is another possibility which is perhaps easier to overlook.
Gold may recover from the recent lows without beginning another major bull run.
Initially, this may sound less interesting than forecasting a return towards record highs. Yet the current market has several characteristics which could produce exactly such an outcome.
Central bank demand is one of them.
According to the World Gold Council, central banks purchased around 321 tonnes of gold during the third quarter, 42% more than a year earlier and the highest quarterly total since late 2024. The organisation currently expects total central bank purchases in 2026 to at least match the 848 tonnes recorded in 2025.
ETF demand has also remained comparatively strong.
Physically backed gold ETFs attracted around 211 tonnes during the third quarter even as bond yields stayed high and the dollar strengthened.
These buyers can help place a floor under the market.
Yet there is another side to the picture.
Demand for bars and coins declined 19% year on year during the third quarter, while jewellery consumption fell to its lowest third quarter level since records began in 2000. India, one of the world’s largest gold markets, is also expected to record its weakest annual demand since 2020.
Here, it is noteworthy that lower prices can gradually bring some buyers back.
The Council also reported earlier in October that physical demand in India had started improving as prices retreated, helped partly by the festive and wedding season.
Such opposing forces could leave gold without a very clear direction for some time.
Long term buyers could support the lower side of the market while high yields prevent another aggressive advance. Gold may then fluctuate within a broad area as traders wait for a more decisive change in economic conditions.
This would fit a comparatively neutral gold outlook.
Moreover, a period of consolidation after such an unusual year would hardly be surprising. Gold moved from above $5,500 to below $4,000 within months, recovered above $4,500 and then fell again.
The market has already travelled a considerable distance in both directions.
Under this scenario, traders could pay closer attention to how price behaves near established support and resistance rather than assuming that every rebound begins another long term rally.
Scenario 3: The Gold Selloff Continues
Of course, a recovery is not the only possibility.
Gold could also move lower again.
As of November 3, markets were pricing roughly a 73% probability of a Federal Reserve rate increase in December. At the same time, renewed tension in the Middle East had pushed oil prices higher and revived inflation concerns.
If this continues, the pressure on gold could remain considerable.
Higher inflation would make it more difficult for the Federal Reserve to reduce interest rates. Treasury yields could consequently stay elevated, while the dollar may continue receiving support.
For gold, this combination has already proved problematic during 2026.
A poll of 30 analysts and traders recently produced a median gold forecast 2026 of $4,495 per ounce, slightly below the previous quarterly forecast. High Treasury yields and a strong dollar were among the main reasons analysts had become more cautious.
The present price is already below that average forecast.
Therefore, another move lower would require traders to examine how buyers respond around the recent one year low.
If gold repeatedly fails to remain above $4,000 and eventually breaks the recent low again, confidence in the recovery could weaken considerably.
There is another issue as well.
Gold is widely considered a safe haven, though that does not mean its price rises during every period of market stress. Investors sometimes sell liquid assets when they need cash quickly. During severe market moves, gold can therefore fall alongside other assets before safe haven demand later returns.
With that said, the World Gold Council believes lower prices could eventually encourage bargain hunting. Its mid year analysis suggested that declines of around 10% to 15% from the levels prevailing at that time could attract demand from consumers and longer term investors.
So, even the bearish scenario has an important question attached to it.
At what price do buyers decide that gold has become attractive again?
What Could Decide Gold's Next Move?
After such a volatile year, looking at gold’s price alone can give an incomplete picture.
Several factors can provide further information about the direction developing underneath the market.
US inflation
Inflation remains particularly important because it influences expectations surrounding Federal Reserve policy. Stronger inflation could keep rates high, while weaker readings could gradually change the present outlook.
Treasury yields
Gold has shown considerable sensitivity to bond yields during 2026. A sustained fall in the US 10 year yield would therefore be worth watching alongside any recovery in bullion.
US dollar
The dollar and gold frequently move in opposite directions, although this relationship is certainly not fixed. Continued dollar strength would make the environment harder for gold, particularly when combined with high yields.
ETF flows
Interestingly, ETFs have remained strong even during major price declines. Continued inflows would suggest that some investors still consider gold attractive at lower prices.
Central bank purchases
Central banks remain one of the strongest structural sources of demand. Their third quarter purchases actually increased despite the large fall in gold prices.
The $4,000 region
Finally, traders may keep a close eye on gold’s behaviour around $4,000. The level has already been crossed several times during the year and could continue carrying psychological significance.
Gold Price Forecast 2026: What Comes Next?
Interestingly, almost every part of the gold market currently gives a slightly different signal.
Prices have fallen sharply.
Treasury yields remain high.
The dollar has been firm.
At the same time, ETFs are still receiving large inflows and central banks have continued purchasing gold at a considerable rate.
This is what makes the present gold price forecast 2026 particularly interesting.
A decline in yields could give gold the conditions required for a broader recovery. Persistent central bank and ETF buying may then provide additional support.
If the macroeconomic picture changes very little, gold could spend some time consolidating after the enormous swings already seen this year.
And if inflation keeps rates elevated while the dollar stays strong, the gold price correction 2026 may still have further to go.
At present, the first few days of November have offered evidence that buyers have not completely disappeared. Yet the rebound remains small when compared with the fall from January’s record.
Consequently, traders looking for a gold price target 2026 may find more useful information in the next movement of yields, interest rate expectations and investment flows than in any single price prediction.
Gold has already changed direction several times this year.
There is little reason to assume the final months will necessarily be any simpler.